AI Portfolio Evaluation
Project Timeline: 2026
Sr. UX Designer | Research Lead & Strategic Partner
Strategic Research & Systems Analysis
My Role
Identified the organizational gap independently and designed the research program from scratch. Synthesized findings across pilot studies, UX research, usage data, and user interviews spanning 4 GTM organizations and 2,000+ employees to produce a portfolio-level strategic analysis that didn't previously exist.
Business Challenge
Indeed's GTM organization was accumulating AI tools faster than it could evaluate them. With 22 tools deployed across Sales, Client Success, Service, and Marketing — and a $15B FY28 revenue goal on the line — there was no shared understanding of what was working, what wasn't, and where the real gaps were. AI investment decisions were being made without a clear picture of the current state.
Impact At-A-Glance
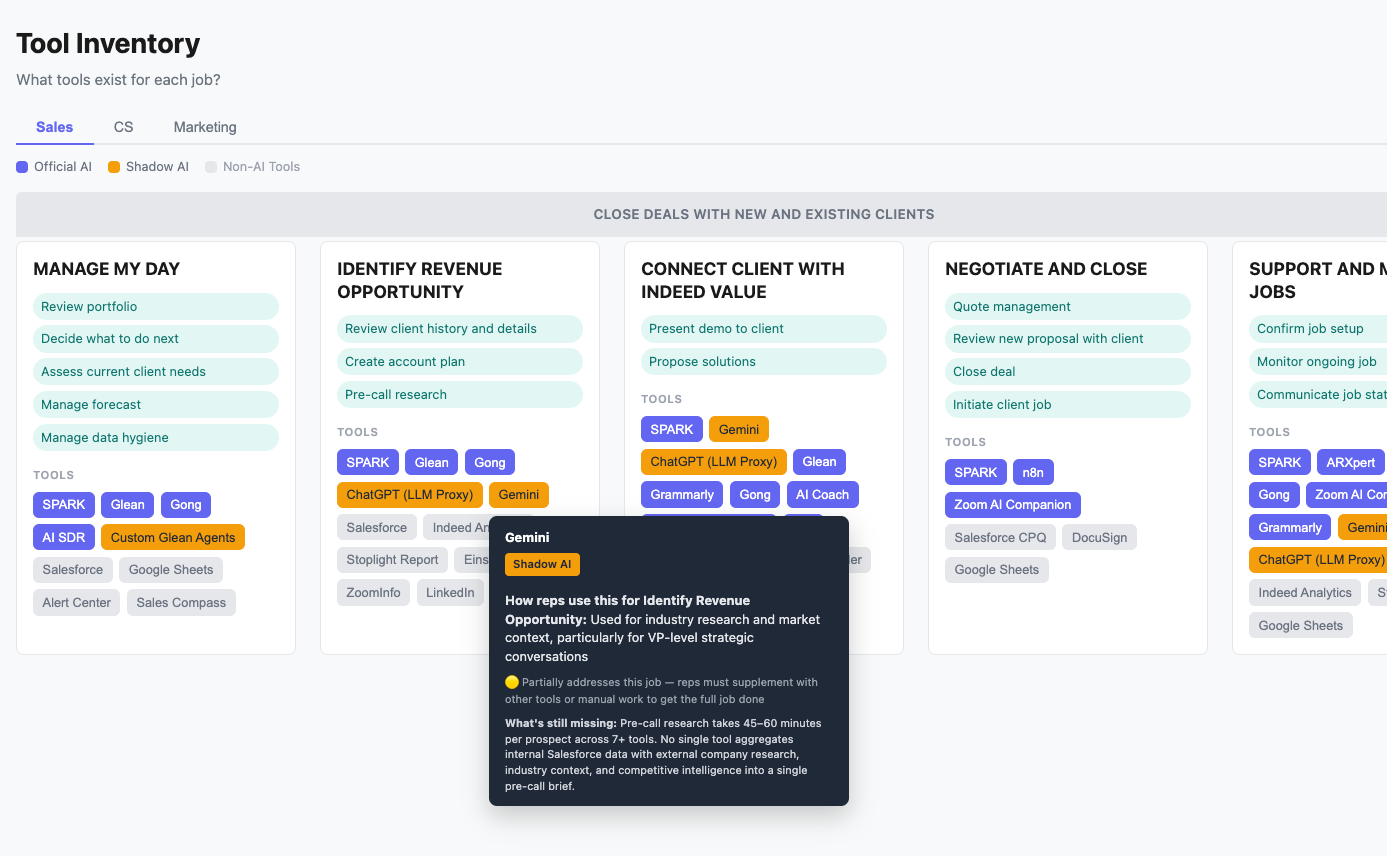
✓ Mapped 22 AI tools to documented JTBD across Sales, CS, and Marketing — revealing only 1 tool earns full coverage for even a single job across the entire portfolio
✓ Synthesized 15+ primary research sources — pilot studies, longitudinal tracking, user interviews, journey maps, and shadow AI documentation — into a unified current-state analysis supporting 2,000+ employees
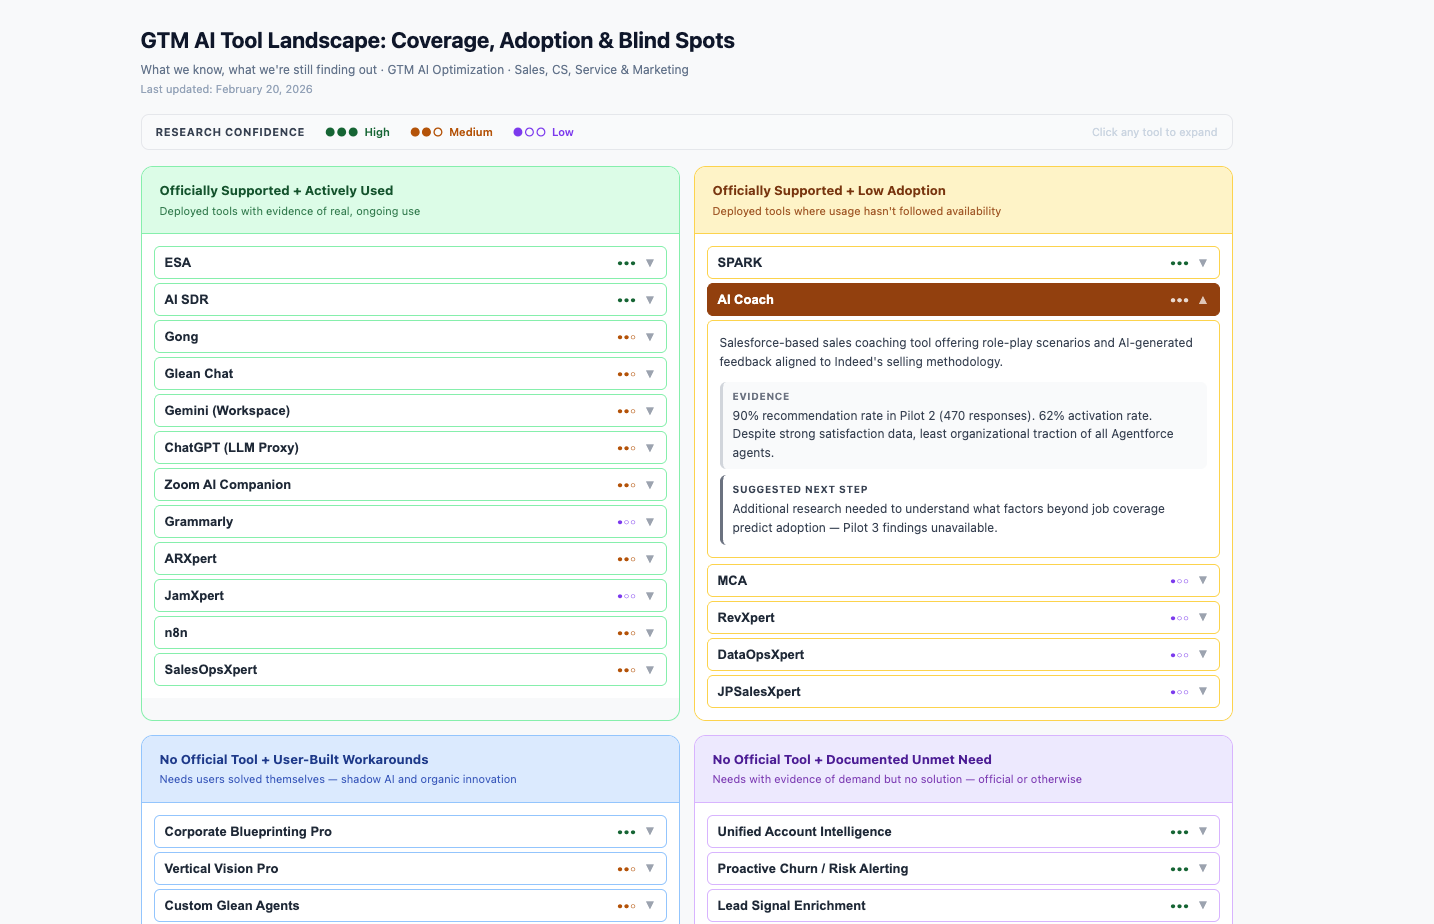
✓ Designed a four-quadrant integration framework replacing documentation that conflated current functionality with aspirational workflows, grounding investment decisions in evidence
✓ Conducted portfolio-level cross-team analysis surfacing systemic patterns — universal partial coverage, shadow AI as gap signal, infrastructure dependencies — invisible at the individual team or product level
✓ Prototyped interactive research artifacts to make portfolio-scale findings navigable for stakeholders — enabling exploration of complex, multi-layered data beyond what static reports or slide decks can communicate

The Journey of a Sale research served as a foundational input — mapping end-to-end sales workflows and identifying where tools and data gaps created friction, establishing the baseline for the GTM AI portfolio analysis
Strategic Challenge
The Trigger: A product owner described difficulty driving impact within their product's scope — outcomes depended on data, systems, and tools outside their control.
The Real Challenge: No Shared Understanding of the AI Ecosystem
Indeed had no portfolio-level view of how its growing AI tool landscape mapped to what GTM teams actually needed to do their jobs:
Product owners were optimizing locally without visibility into dependencies
GTM teams were evaluating tools in isolation, unaware of gaps and redundancies across the portfolio
Leadership was making AI investment decisions without a current-state foundation to build from
Without a cross-team strategic view, every team would continue solving their piece independently — while systemic gaps went unaddressed and investment decisions were made on incomplete information.
Process
I designed a multi-source synthesis approach rather than starting from zero — integrating existing data sources into a single coherent analysis for the first time.
Phase 1: Tool Inventory & Categorization — Documented all 22 tools across four categories: Agentforce products, BT&T Analytics tools, enterprise-approved third-party tools, and user-adopted shadow AI
Phase 2: JTBD Framework Development — Applied Jobs-to-be-Done mapping across Sales, CS, and Marketing to create consistent evaluation criteria across all teams
Phase 3: Multi-Source Data Synthesis — Integrated pilot study data, 100+ hours of Salesforce blueprinting sessions, Dovetail qualitative insights, usage metrics, and shadow AI documentation
Phase 4: Cross-Team Pattern Analysis — Surfaced findings only visible when looking across all organizations simultaneously

Demonstrating the gaps and workarounds each department enabled within the context of JTBD
Key Decisions
-
Informal tool use across Sales, CS, and Marketing could have been documented as a compliance concern. Instead I treated it as a leading indicator of unmet need — and the pattern it revealed, the same jobs going unaddressed across all three teams, is what made the portfolio-level gaps legible.
-
Every source in this project carries a confidence rating. CS JTBD frameworks built from 100+ hours of recorded interviews carry different weight than a Marketing JTBD synthesized from existing documentation in February 2026. Treating those equally would have produced false confidence in the conclusions. Where evidence was thin, I said so.
-
Individual tool evaluations already existed. The missing view was the full portfolio simultaneously. Stepping back to that level is what surfaced findings that wouldn't appear in any single team or product document — including the finding that only one tool in the entire portfolio earns full coverage for even a single documented job.
-
The individual JTBD frameworks for Sales, CS, and Marketing each documented unmet needs within their own context. The more consequential question was whether those needs were truly team-specific or whether they reflected something shared underneath. By analyzing across all three frameworks simultaneously, I identified a set of cross-team gaps — jobs like holistic context assembly, knowledge reliability, and proactive alerting — that no single team's research could have surfaced alone. When the same unmet job appears independently across three different organizations, it becomes a stronger signal for investment than any single team's pain point could be.
-
Cross-team patterns could easily be read as investment recommendations. But the analysis also surfaced findings that complicated a straightforward "fill the gaps" logic — most notably that AI Coach, the only tool with full job coverage evidence in the entire portfolio, also has among the lowest organizational traction. If strong job coverage doesn't reliably predict adoption, then gap analysis alone is insufficient as an investment framework. I positioned these as open questions rather than conclusions, because the research could surface what was true — it couldn't determine what to do about it.
Results
What This Research Enabled
✓ Delivered a portfolio-level view that surfaced findings invisible at the product level — including that the tool with the strongest job coverage evidence has among the lowest adoption, raising unresolved questions about what actually drives AI tool success at Indeed
✓ Developed an AI tool inventory matrix — visualized as an interactive artifact — giving stakeholders a clear way to distinguish what tools currently do, what's being worked around, and what remains unaddressed. A single navigable view that didn't exist before.
✓ Identified admin reduction as the highest-leverage AI opportunity, grounded in data showing only 31% of rep time spent on active selling
✓ Named the infrastructure-before-AI problem as the critical blocker — directing investment toward data infrastructure before additional AI tools
✓ Prototyped interactive research artifacts to make portfolio-scale findings navigable for stakeholders.